It has been impossible to get a complete picture of reported COVID-19 cases in Saskatchewan since August 2020.
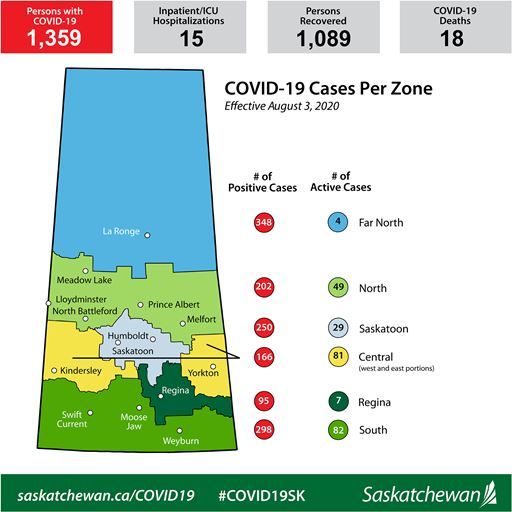
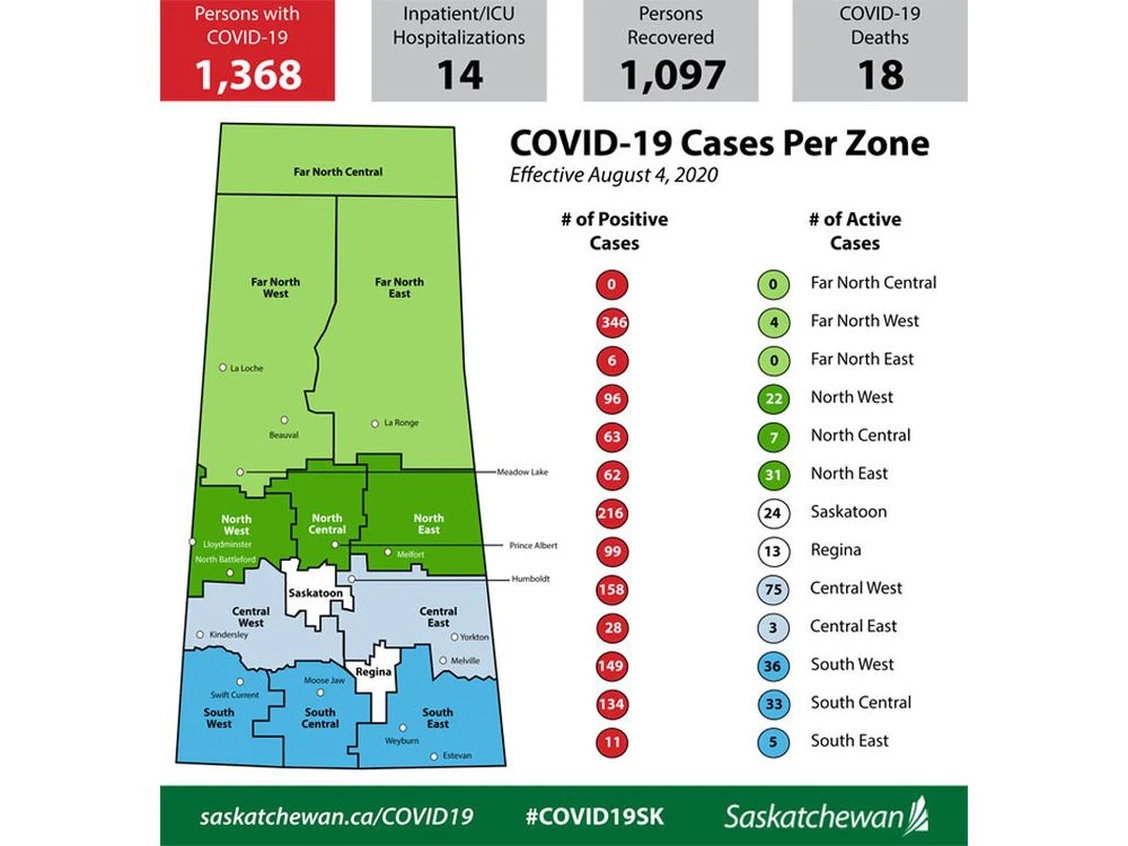
This stems from a decision by the Saskatchewan Ministry of Health to begin reporting cases using 13 zones instead of the original 6. This crossover occurred on August 4, 2020.
More spatial granuality in case reporting is a good thing. As we have been constantly reminded, we are not facing a single epidemic but many, many localized epidemics.
I have been providing COVID-19 data since March 2020 as part of the COVID-19 Canada Open Data Working Group. This move from 6 zones to 13 created a problem for us, since Saskatchewan did not provide data prior to August 4, 2020 using the new boundaries. Thus, if we switched over to using the new boundaries, our zone-level time series would look something like this:
Often, boundary changes involve either merging several smaller regions into one or splitting one big region into several smaller ones, but this wasn't the case here. Most noticeably, the Saskatoon and Regina zones were much smaller under the new boundaries, with pieces of them being redistributed to the surround zones. For example, Saskatoon lost almost 15% of its cases during the transition from August 3, 2020 (old boundaries) to August 4, 2020 (new boundaries). For this reason, simply trying to map the old boundaries to the new boundaries wouldn't work, since it results in several large discontinuities in the cumulative case counts:
For nearly a year, our group has adopted the messy compromise of adding the daily number of new cases in each of the 13 zones to their approximate equivalents in the old 6 zones (e.g., 3 new cases in "North West" and 2 new cases in "North Central" would add 5 new cases to "North"; 7 new cases in "Saskatoon" would add 7 new cases to "Saskatoon"). This avoids the messy discontinuities in cumulative case numbers seen above. However, it also means our dataset does not match the official data on the Saskatchewan website. But unlike the official data, our dataset provides a continuous, uninterrupted case time series, without which incredible data visualizations such as this one from Naël Shiab would not be possible.
This compromise has always been unsatisfying. It was obvious that the Ministry of Health had recoded the old case data using the new boundaries, since they provided cumulative case numbers for August 4, 2020 using the new boundaries. The data existed to fill the gap in the timeline of COVID-19 opened up by the change in boundaries, but it wasn't being provided. I emailed the Ministry several times to suggest releasing these recoded historical data, but my queries were not acted upon.
Eventually, in late May of this year, I realized I could probably obtain the data I needed through a Freedom of Information request. Two months later, the Ministry of Health sent me this PDF containing several tables of daily case data from prior to August 4, 2020 recoded to the new 13 zones. Not surprisingly, it was an image PDF, meaning I had to OCR the document before even attempting to extract the data.
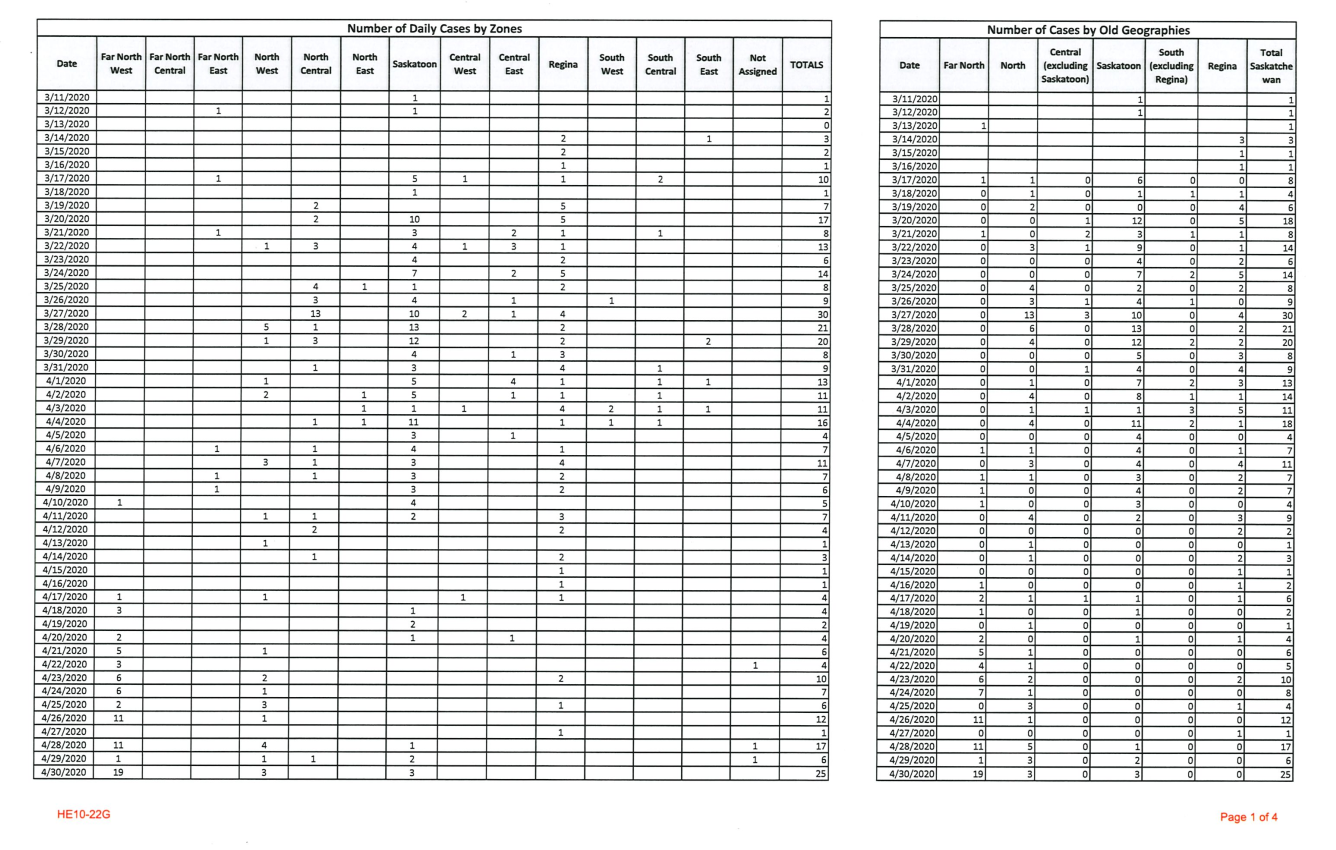
After some significant data wrangling, I managed to construct the first complete time series of COVID-19 cases in Saskatchewan using the new 13 reporting zones:
Zooming in on the August 4, 2020 transition from 6 zones to 13:
The primary issue with this dataset concerns the "Not Assigned" zone. This is because in the tables they sent me, the number of cases in the "Not Assigned" zone only ever increments, whereas in the course of normal reporting, cases move out of this category over time as they are assigned to a specific zone. Thus, the number of people in the "Not Assigned" zone goes from 45 to 0 from August 3, 2020 to August 4, 2020. Other minor discrepancies can be chalked up to the differences in the date variables used for internal reporting (the tables I received through my Freedom of Information request) and external reporting (the publicly available data spreadsheet).
In the absence of an official dataset covering the entire span of the pandemic being released by the province, I am confident that this is the best timeline of COVID-19 in Saskatchewan that we are going to get.
Some time from now, when the pandemic is in our rear view, we are going to want to know what happened. That means having detailed and accurate historical records. Freedom of Information requests will be an invaluable tool in this endeavour.
The complete time series of COVID-19 cases in Saskatchewan, along with all the other code and data used in this post, are available on GitHub.
An actively updated version of this dataset will be available shortly from the COVID-19 Canada Open Data Working Group.
Addendum: A complete timeline of COVID-19 deaths in Saskatchewan
The response to my Freedom of Information request claimed that only case data were recoded to the new boundaries (and not deaths, hospitalizations, etc.). This can't be true, since the 18 deaths that occurred before August 4, 2020 are included in the cumulative death totals using the new boundaries.
| Zone (13 zones) | Approximate matching zone (6 zones) | Cumulative deaths as of August 4, 2020 |
|---|---|---|
| Far North West | Far North | 7 |
| North West | North | 4 |
| North Central | North | 1 |
| Saskatoon | Saskatoon | 2 |
| Central East | Central (excluding Saskatoon) | 1 |
| Regina | Regina | 1 |
| South Central | South (excluding Regina) | 2 |
| Total | 18 |
Thankfully, no deaths were transferred between zones after redrawing the boundaries, unlike with cases. The only issue blocking the creation of a complete zone-level time series of deaths using the new boundaries is the deaths in North West and North Central—it is impossible to know which date to assign the North Central death to (since both the North West and North Central deaths are only identified as "North" in the pre-August 4 dataset).
A local obituary search identifies a plausible date for the North Central death (matching date and age range and the cause of death is not disqualifying), but I have followed up with the Ministry of Health for additional records.