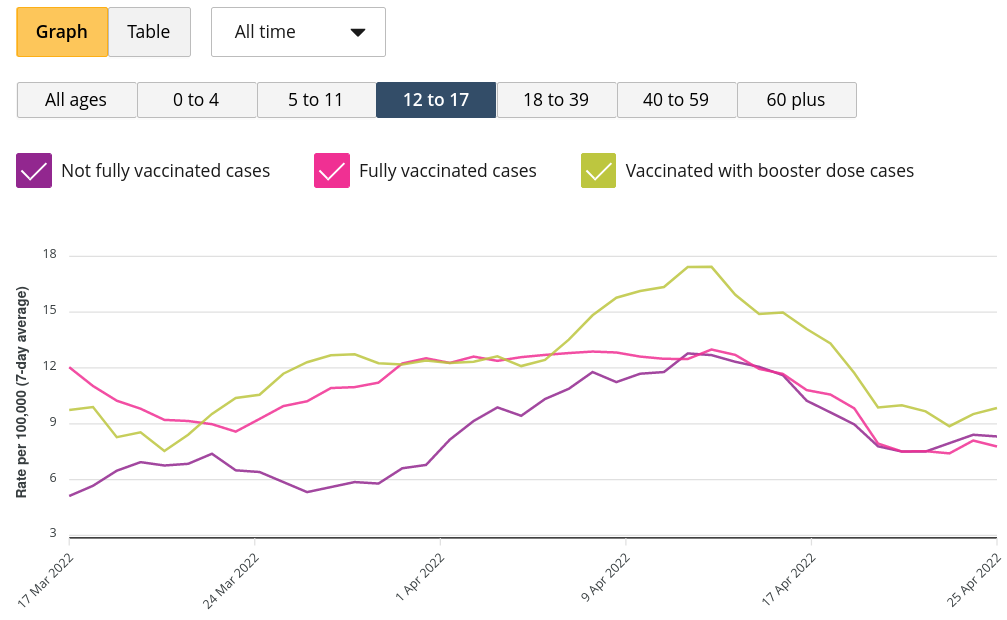
Some variant of the chart below has been circulating aggressively on Twitter for the past several days.
This seems to trace back to an article from TheCounterSignal.com entitled "ONTARIO: Fully vaccinated three times as likely to be infected with COVID-19". Note that I've linked to an archived version since the original article appears to have been scrubbed from the website and the author's Twitter.
The chart itself is accurate, in the sense of having being sourced directly from the Ontario COVID-19 dashboard. However, the chart's interpretation is wildly inaccurate, and made all the more painful by the author's utter incuriosity in explaining the observed trends beyond a tired invocation of "vaccines bad".
The very important question the author neglects to ask: who is being tested?
Ontario reports only cases that have been confirmed by PCR test. However, PCR testing has been severely restricted since the beginning of 2022. At this time, eligibility was restricted to mostly symptomatic individuals in the following categories: healthcare workers, staff and residents in congregate living settings such as long-term care, candidates for outpatient COVID-19 treatment, hospitalized patients, school staff and students and a handful of other groups at higher risk of severe outcomes. With a few exceptions (notably schools), the unifying factor here is that these groups are much more likely than the general population to be vaccinated and boosted, either due to job requirements (staff) or vulnerability (LTC residents, those likely to benefit from early COVID treamtent).
Remember, the PCR-confirmed case data presented in the original chart represents only those who were 1) eligible to be tested, 2) willing to be tested and 3) actually successful in receiving a test. This is important because if most people being tested are boosted, then of course we expect most confirmed cases to be boosted, since we are capturing a much higher fraction of infections in the boosted group. This means we could falsely conclude that being boosted increases your chance of becoming infected even if it in reality lowers your chance!
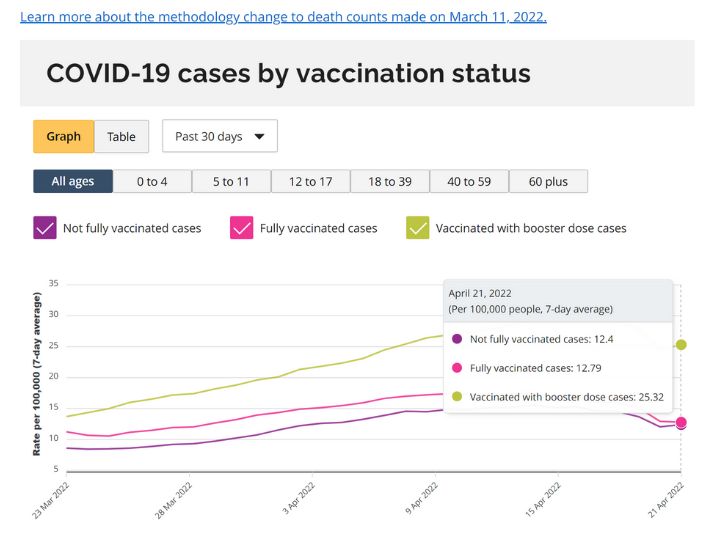
Unfortunately, there are no data on testing rates by vaccination status, so we can't adjust for this directly. However, it is instructive to look at age-stratified case rates by vaccination status. Vaccination coverage (and third dose/booster coverage) generally rises by age, being highest in the oldest (and thus most vulnerable) groups.
Among those 60+ (the most surveilled group as well as the most boosted due to higher vulnerability to severe outcomes), the apparent trend is reversed: those with 0 or 1 doses are much more likely to be infected!
The original pattern (highest case rate in boosted group) holds in the 18 to 39 and 40 to 59 group, however. Again, ask who is being tested in the 18 to 59 age groups. Based on eligibility criteria, I suspect testing is being apportioned primarily to those who are more medically vulnerable or those who work with those who are more medically vulnerable. In both cases, these people are both more likely to be boosted and more likely to seek testing given that they are eligible.
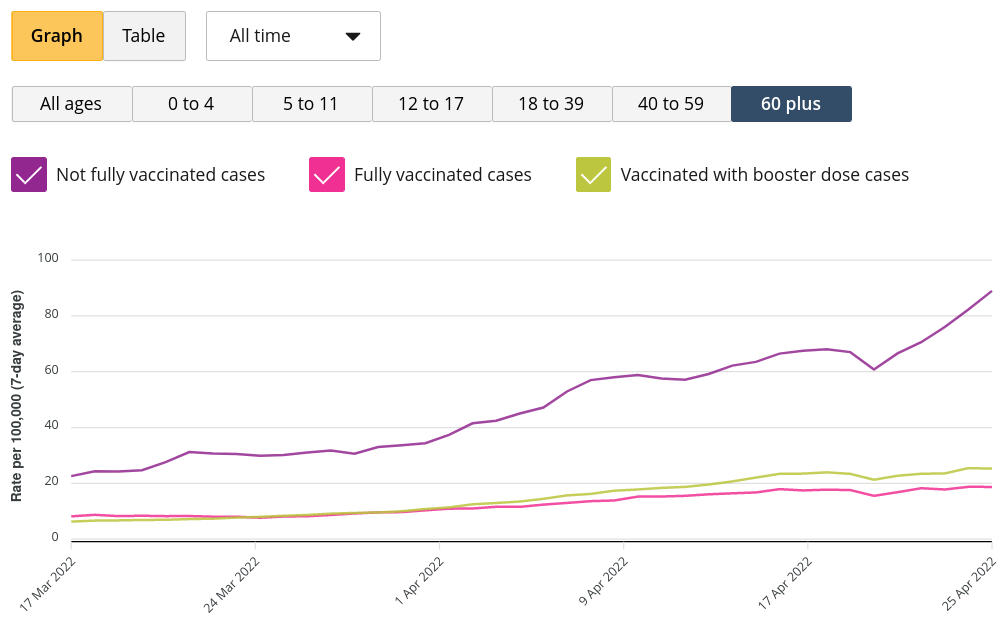
Children under 18 are somewhat of a special case. Obviously, few under 12 are boosted. For 12 to 17, the rates are presently similar among the groups but all the arguments that apply above hold here: if you are more medically vulnerable, you are probably have a much higher chance of 1) being boosted and 2) being eligible for a PCR test and willing to get one.
To recapitulate: among those 18 to 59, people eligible and willing to take a PCR test (and thus appearing in the calculations of confirmed case rates by vaccination status) are probably much more likely to be boosted than the general population in their age group. Because of this, it should come as no surprise that it appears that boosted people have higher infection rates for COVID-19, since we are capturing a higher fraction of total infections, even if boosted individuals actually have a lower chance of being infected!
This bias is somewhat lessened for those 60+, since it is much easier to get a PCR test in this age group. And indeed we see the apparent trend reversed in this older age group: those not fully vaccinated have much higher reported case rates.
As a final illustration, let's look at a time series of the Public Health Agency of Canada's "cases following vaccination" data. The chart below shows the proportion of cases by vaccination status for cases reported since the beginning of Canada's vaccination campaign.

Notice that massive discontinuity at the beginning of 2022? That is to say, the exact point where every province gave up on mass PCR testing? That's the effect of changing who gets tested—suddenly, unvaccinated people were much less likely to qualify for a test (and boosted people much more likely to qualify).
Of course, the immune evasion of Omicron plays a role too, but recall that the Omicron wave began in early December of 2021 and confirmed cases peaked in early January of 2022.
As always, it behooves us to remember the central rule of epidemiology: the data never speak for themselves.
Oh, and one more consideration regarding the rate of PCR-confirmed COVID-19 cases among the unvaccinated:
The big caveat to this analysis: as hesitancy drops and access to vaccination improves, a greater fraction of the unvaccinated will be hardcore anti-vaxxers. A subset of this group may be inclined to NEVER get tested for COVID-19 unless they absolutely have to.
— Jean-Paul R. Soucy 🇨🇦 🇺🇦 (@JPSoucy) August 7, 2021
You can't get counted as a PCR-confirmed COVID-19 case if you are committed to never getting tested.
Data and code used in this post are available on GitHub.